

Digital transformation creates value not simply through more data, software, or dashboards, but when data helps businesses identify problems earlier, understand changes, and make better decisions. For textile and garment companies data used for management includes not only orders, productivity, quality, and inventory, but also exchange rates, interest rates, raw material prices, logistics, market demand, and trade policies. Connecting these signals to decisions and actions is the shift from digitized reporting to data-driven management.
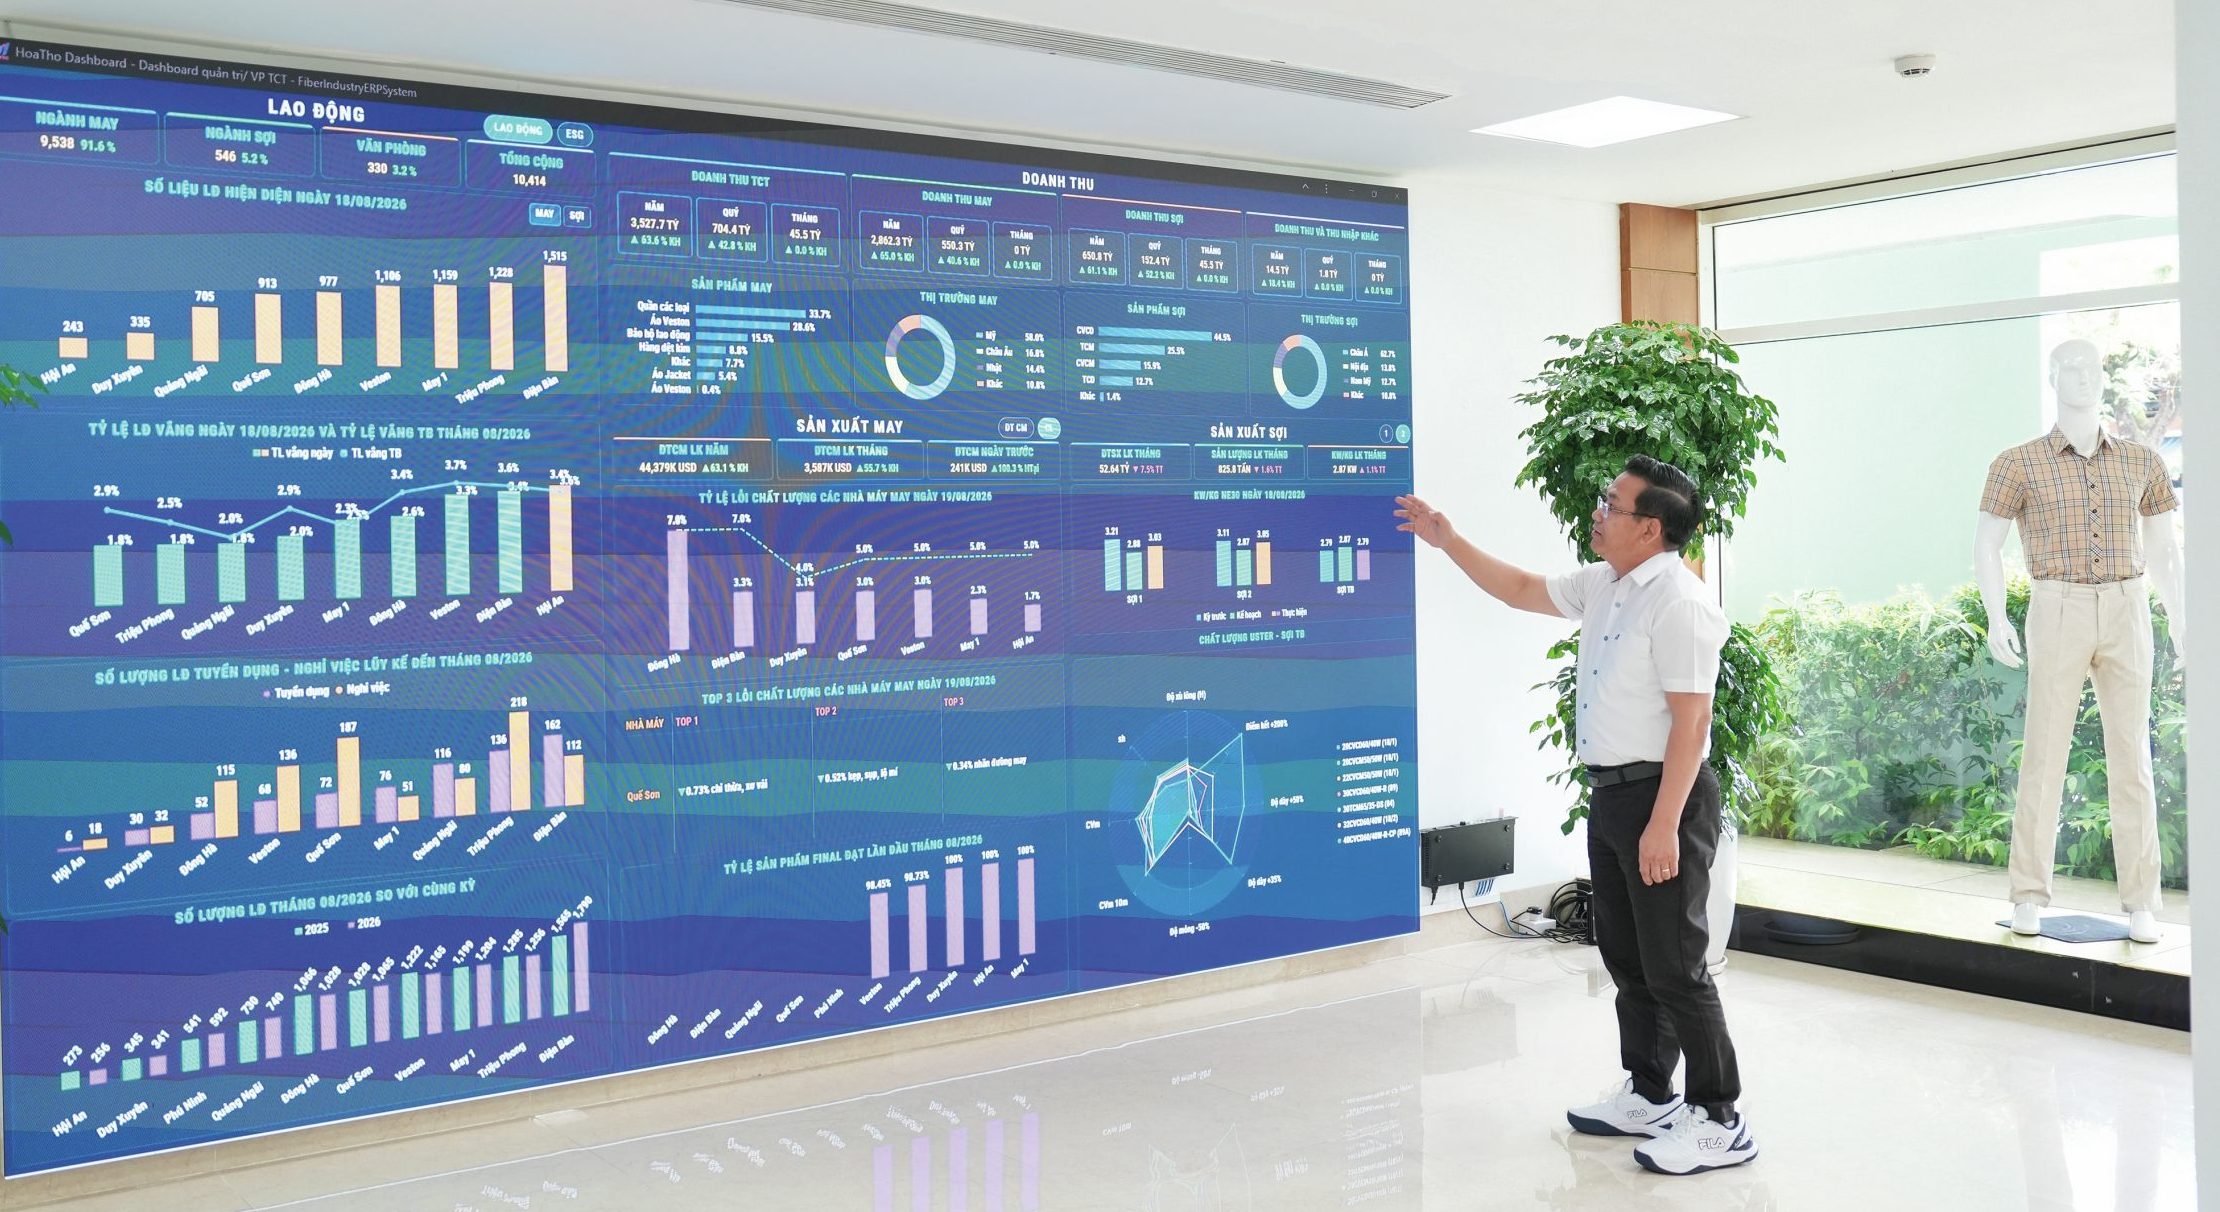
When Businesses Are No Longer “Data-Hungry”
Early digital transformation focused moving activities from paper records, spreadsheets and manual processes into digital systems. ERP and software for production, HR, finance, warehouses, orders and customers have become increasingly common, while dashboards allow leaders to monitor key indicators without waiting for periodic reports.
But as businesses become more digital, one question remains: Are we actually managing better?
A McKinsey survey of more than 100 manufacturing operations executives, published in May 2026, found that 74% of companies had established a common global production system, but only 29% had fully deployed it across all sites. Nearly three-quarters used standardized digital tools, but their use remained limited in most cases. No company reported that advanced analytics, AI or GenAI had been fully integrated into decision-making.
The challenge is therefore not only technology, but also management. A dashboard may show that revenue is below plan or defects exceed standards, but managers still need to know: Why? How serious is the impact? What should be addressed first? Who is responsible?
The key gap is no longer from “no data” to “data,” but from “data” to “managing by data.”

From a Mirror of the Business to the Executive’s “Radar”
Early-generation dashboards act like a mirror, showing internal operations: orders, output, productivity, equipment efficiency, cash flow and margins.
But businesses operate in an open environment. Exchange rates affect export margins; cotton purchasing depends on global prices, supply and demand; interest rates affect financing costs. Energy, freight, market demand and trade policies can also influence business plans before appearing in financial reports.
At the executive level, therefore, dashboards need a “radar” function: capturing, filtering and alerting managers to important external signals.
A July 2026 McKinsey analysis noted that advanced organizations are connecting operational and financial data with external signals. Identifying risks and opportunities earlier gives managers more time to assess options and act.
This does not mean dashboards should contain as much data as possible. Operational dashboards may focus on production, while executive dashboards need to give insights into markets, finance, raw materials and resources. Update frequency should also match the pace of decision-making.
Data Must Lead to Decisions
The value of data follows a simple loop:
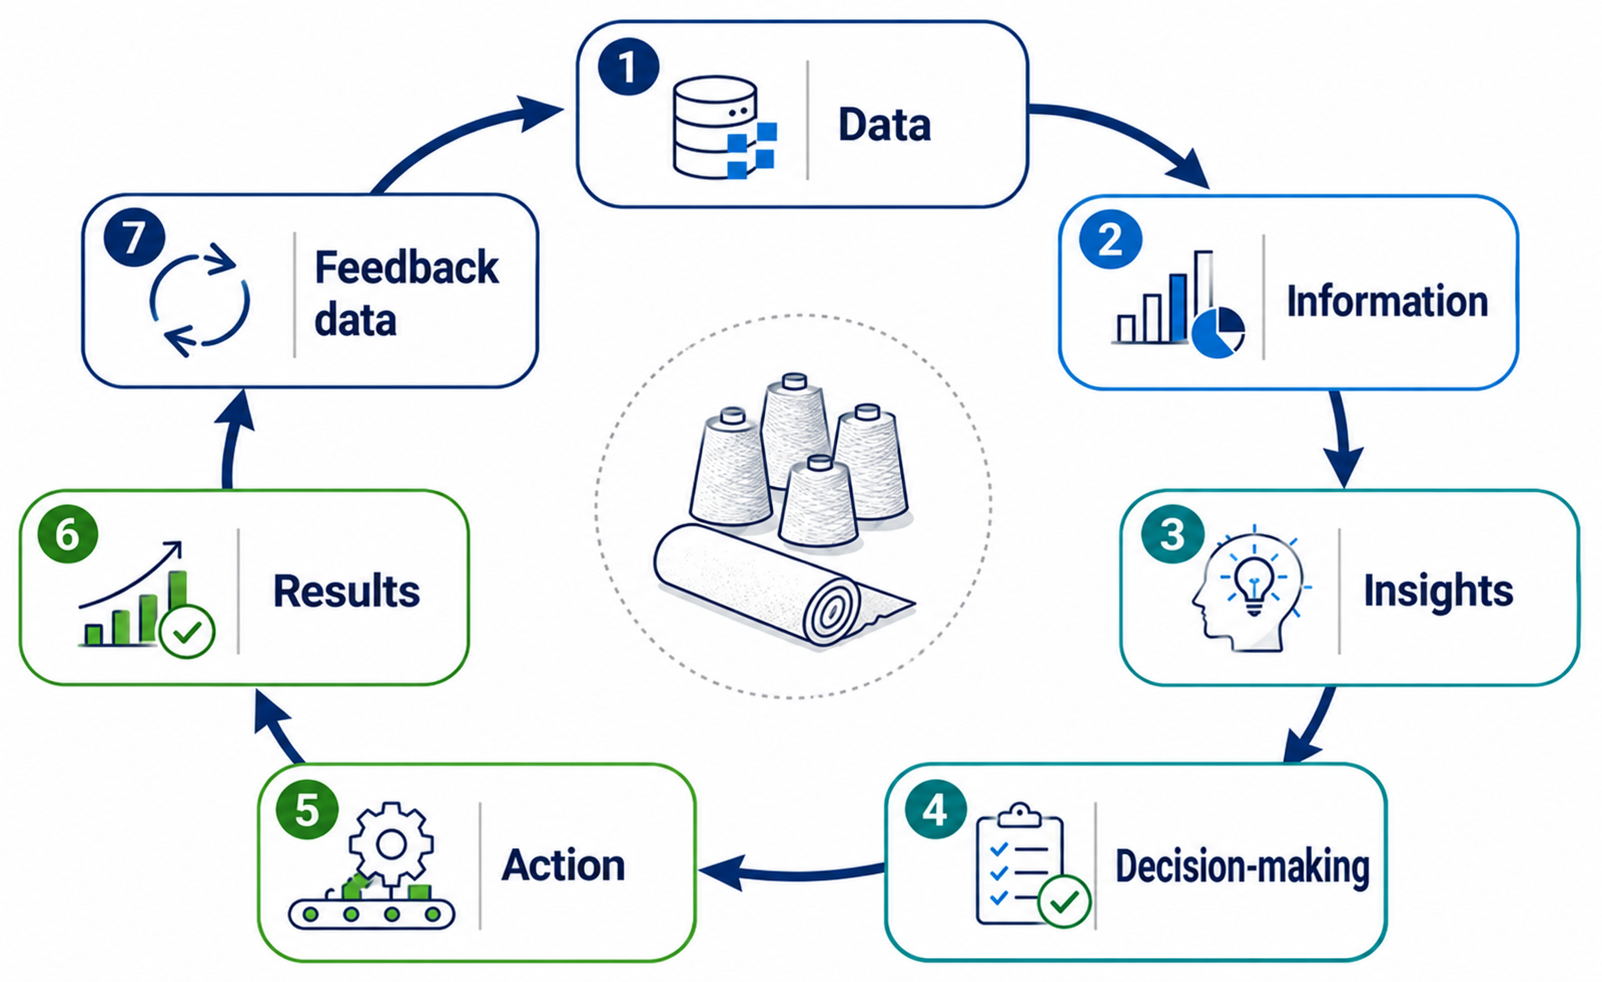
McKinsey describes this approach as “continuous, connected insights” – insights connected to execution. Data becomes meaningful when it helps identify a problem, turn it into a management decision, and feed the results back into the system.
Therefore, KPIs should be organized around decisions, not treated as isolated indicators.
In garment production, order progress, WIP, line productivity, labor and quality data can support decisions on line balancing, resource allocation and production priorities.
In spinning, cotton prices, exchange rates, inventory, financing costs and order outlook can guide raw-material purchasing. In weaving and dyeing, data on reprocessing, energy, chemicals, schedules and margins can help identify which process or order requires intervention.
At group level, data on orders, capacity, profitability and working capital can support resource allocation and management priorities.
The common point is not the number of KPIs, but whether different signals converge on a specific management decision.
A McKinsey case study of a medical-device manufacturer found that its Digital S&OP Control Tower reduced inventory value by 50% and backorders by 60%, while improving service levels by 10–20%.
A dashboard creates real value when managers know not only “what is happening,” but also “what decision needs to be made.”
A dashboard creates value when managers know not only what is happening, but what decision needs to be made.
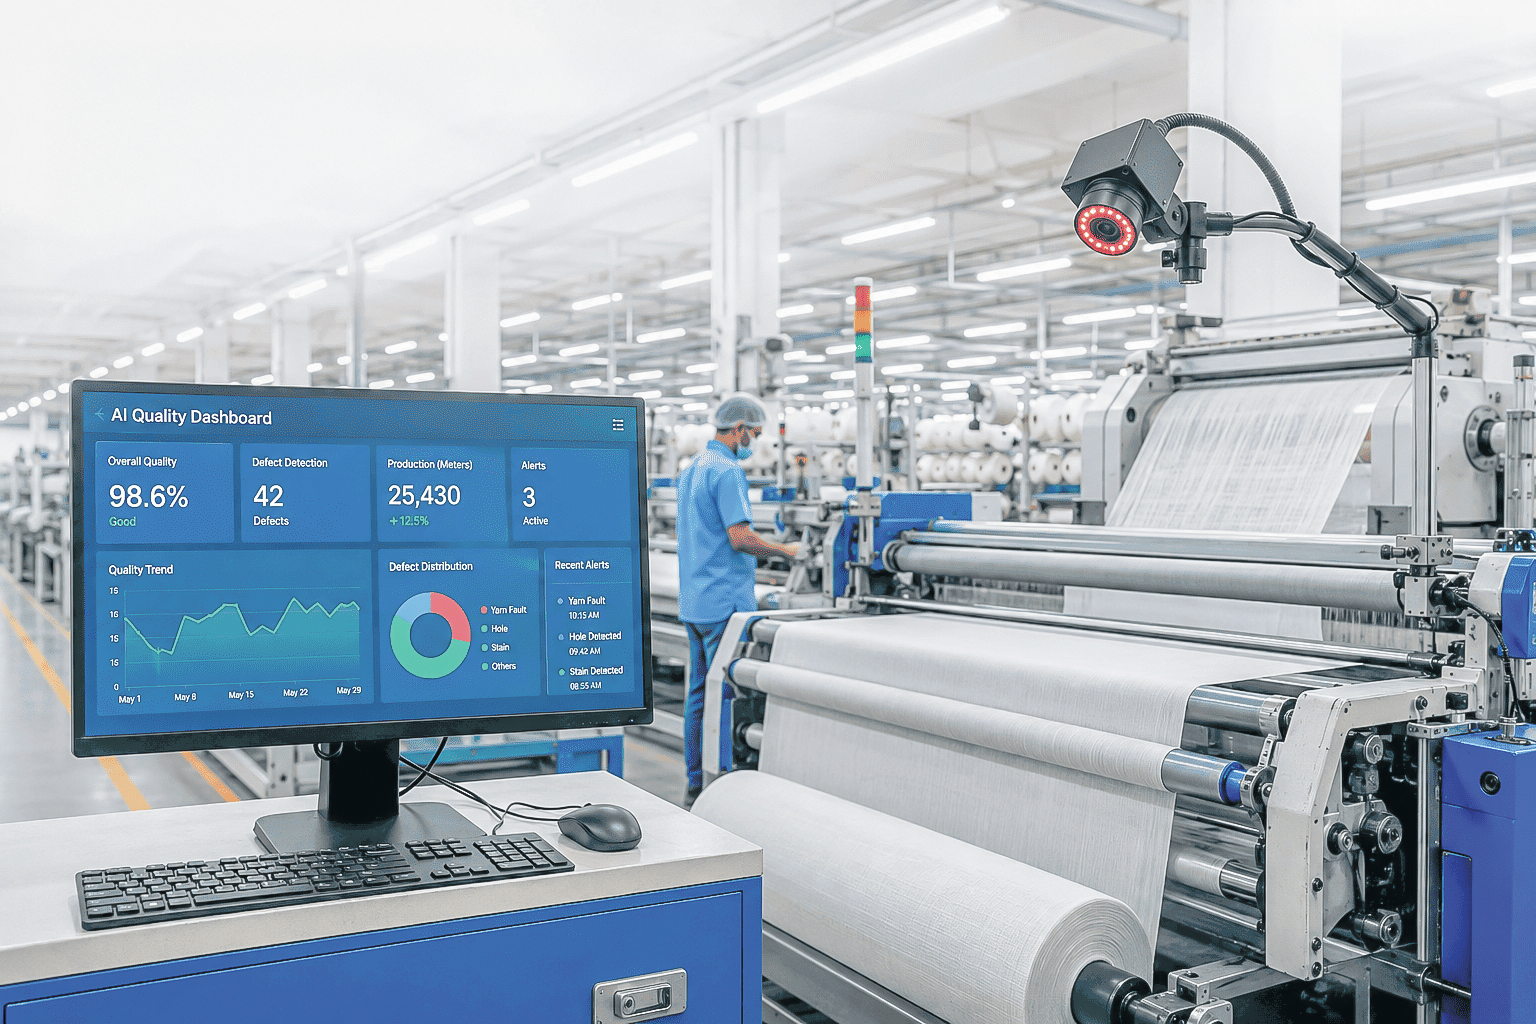
From Decisions to Business Results
A good decision matters only when its impact is reflected in operational and financial performance.
Deloitte’s 2026 Manufacturing Industry Outlook, citing its 2025 Smart Manufacturing Survey, reported that 92% of executives surveyed agreed that smart manufacturing initiatives would be a major driver of competitiveness. Companies reported average improvements of around 10-20% in output, 7-20% in labor productivity, and 10-15% in released production capacity after implementation.
These figures do not mean every digital project delivers the same results. What matters is the link between decision and outcome.
Timely line adjustments can reduce late delivery risk. Early intervention when quality drops can reduce rework and waste. Better raw-material purchasing decisions can reduce costs. Capacity reallocation can improve equipment and labor utilization.
When these operational impacts are translated into measurable figures, the economic value of digital transformation becomes clearer. Businesses therefore need to answer: Which KPI does the dashboard affect, through which decision, and what business value does it create?
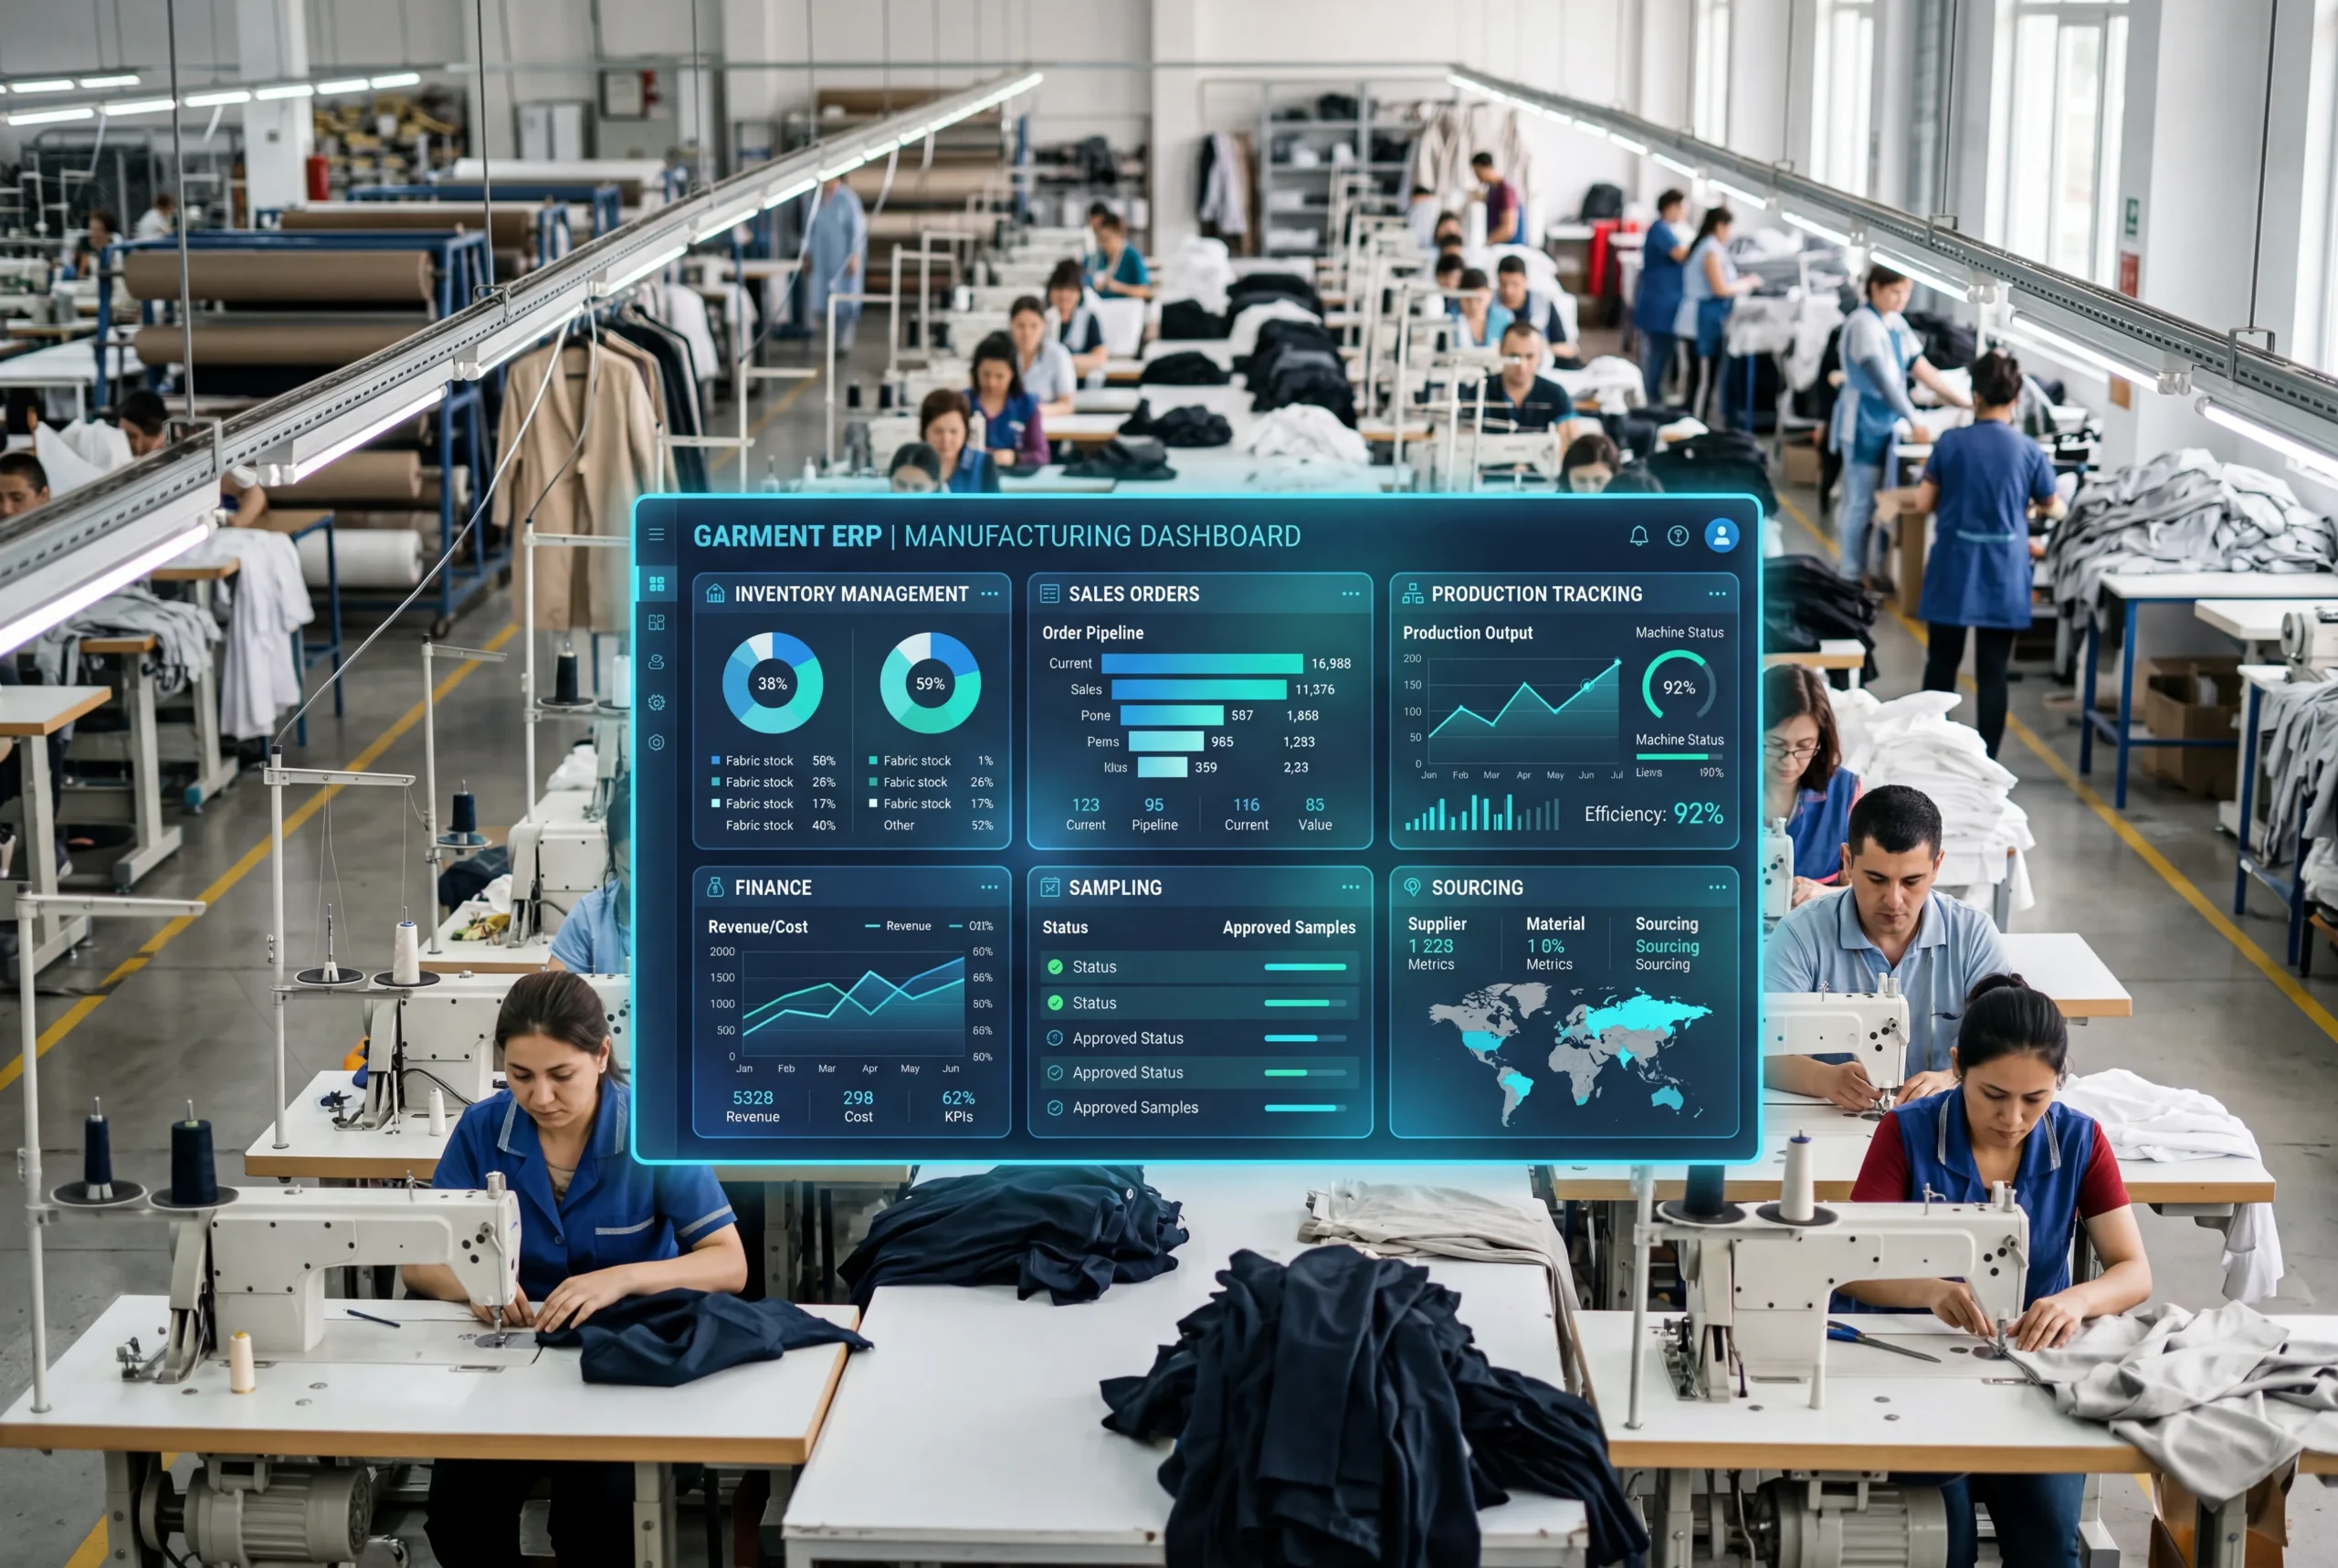
Five Principles for Building Executive Dashboards
The design of a dashboard – as a management tool should begin not with “What data do we have?” but with “What decisions do managers need to make?”
A dashboard with 70 indicators is not necessarily better than one with 10 critical indicators. A red alert without a threshold, responsible person or response deadline only creates an “illusion of control.”
First, start with business objectives. Link the dashboards to the results the business wants to improve: profitability, productivity, costs, quality, delivery, inventory, working capital, or capacity.
Second, identify decisions to support. Determine which decisions directly affect those objectives – such as accepting orders, purchasing materials, allocating capacity or deciding where to intervene.
Third, ensure a common meaning for data.
Each KPI needs a consistent definition, calculation, source, update frequency and responsible unit. External data also requires a clear source and update timing.
Fourth, establish thresholds, exceptions and accountability. The dashboard should highlight deviations significant enough to require attention. Each alert should specify the threshold, responsible person, authority to act, and response time.
Fifth, close the loop through feedback. Once a decision is implemented, the system must measure its results. If a KPI does not improve, the organization needs to see this and adjust its approach. This is what turns a dashboard from a reporting tool into part of a management learning system.
A World Bank ERP trial among Vietnamese SMEs found that nearly 80% used the platform after training, but the rate fell to around 40%, and after about 18 months only 35% continued using it. Sustained adoption was associated with an implementation champion, senior leadership support and sufficient authority to drive change.
The lesson is simple: technology deployment does not automatically become management practice. A useful dashboard must connect objectives, decisions, accountability and daily work.

When Data Becomes a Management Capability
In a stable environment, reports on what has happened may be sufficient. In a volatile environment, they are not.
Textile and garment companies must respond to changes in demand, orders, raw material prices, exchange rates, financing costs, logistics, labor and trade policies.
The advantage comes from recognizing change earlier, assessing its impact faster, and acting before the problem appears in business results.
The ultimate test of a dashboard comes down to three questions: What did it help the business see sooner? What decision did it change? What result did that decision create?
When these questions can be answered, data is no longer simply a by-product of digital transformation. It has become a management capability – bridging the gap from dashboard to decisions, and from decision to business performance.